
Long Beach Island Real Estate Oceanblock Sales Update
- Jan 14, 2019
- 4 min read
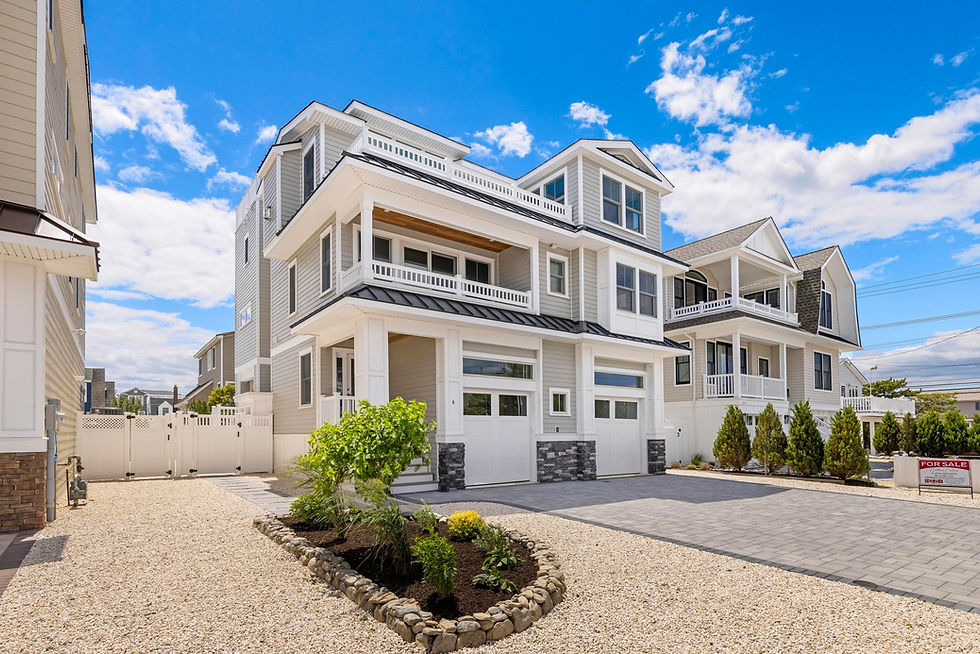
Single Family Oceanblock Home Sales in the LBI NJ Real Estate Market

LBI NJ Real Estate
Long Beach Island Real Estate Oceanblock Sales Updates are very helpful when looking to buy, sell or invest on Long Beach Island. The Oceanblock areas of LBI offer great opportunity and great insight for the overall market. Far less expensive than a home on the oceanfront, oceanblock single family homes offer great views, great beach access and a more affordable price. It is helpful to look at what is pending (under contract) and what has recently sold in the LBI real estate market on the oceanblock over the past 2 months or so. Below is a summery of single family home sales in the LBI real estate market limited only to the oceanblock.
There are currently 3 homes under contract
23 homes sold in the past 60 days
The average price of a single family home on the oceanblock was $1,556,730
Long Beach Island Real Estate Oceanblock Sales Update
Below is a breakdown of all single family home sales, both closed and pending as of the time of my writing this update, in the LBI real estate market:
MLS# | Status | Street Number | Street Name | Municipality | Section | Current Price | Beds Total | Baths Full | Baths Half | Sq Ft Total | DOM |
4055088 | C | 99 | 30th | Ship Bottom | Ship Bottom | $790,000 | 3 | 2 | 1 | 2,266 | 23 |
4056920 | C | 32 | North 25th Street | Surf City | Surf City | $820,000 | 4 | 2 | 1 | 1,200 | 13 |
4053408 | C | 4 | 19th | Barnegat Light | Barnegat Light | $925,000 | 6 | 2 | 1 | 3,168 | 14 |
4053864 | P | 6201 | Long Beach | Harvey Cedars | Harvey Cedars | $968,000 | 4 | 2 | 0 | 2,088 | 117 |
4050111 | C | 122 | E 20th | Ship Bottom | Ship Bottom | $985,000 | 4 | 3 | 1 | 1,800 | 63 |
4044076 | C | 4308 | S Long Beach | Long Beach Twp | Holgate | $999,999 | 5 | 4 | 0 | 2,600 | 295 |
4048040 | C | 133 | 14 | Ship Bottom | Ship Bottom | $1,050,000 | 4 | 2 | 0 | 2,000 | 196 |
4049696 | C | 219 | Liberty | Beach Haven Borough | L.E.H. Yacht | $1,140,000 | 4 | 3 | 1 | 2,580 | 129 |
4055092 | C | 121 | 6th | Ship Bottom | Ship Bottom | $1,200,000 | 4 | 3 | 1 | 2,754 | 78 |
4053557 | C | 116 | Glendola | Beach Haven Borough | L.E.H. Yacht | $1,200,000 | 5 | 3 | 0 | 2,292 | 41 |
4055348 | C | 206 | Pelham | Beach Haven Borough | L.E.H. Yacht | $1,300,000 | 4 | 2 | 1 | 2,088 | 29 |
4047964 | C | 157-C | Long Beach Blvd | Long Beach Twp | Loveladies | $1,300,000 | 4 | 2 | 0 | 2,044 | 164 |
4047660 | C | 101 | Lillie | Long Beach Twp | Beach Haven Park | $1,300,000 | 4 | 3 | 1 | 1,952 | 229 |
4049352 | C | 7 | Seaview | Long Beach Twp | Loveladies | $1,350,000 | 4 | 2 | 0 | 1,544 | 172 |
4058247 | P | 18 | 48th | Long Beach Twp | Brant Beach | $1,399,000 | 5 | 3 | 1 | 2,200 | 28 |
4047691 | C | 23 | 39th | Long Beach Twp | Brant Beach | $1,400,000 | 5 | 3 | 1 | 2,984 | 192 |
4056587 | C | 11 | 10th | Beach Haven Borough | Beach Haven | $1,425,000 | 4 | 2 | 2 | 2,838 | 59 |
4053904 | P | 135 | 16th | Ship Bottom | Ship Bottom | $1,439,000 | 6 | 4 | 1 | 2,364 | 109 |
4049667 | C | 18 | Stockton Avenue | Long Beach Twp | Brant Beach | $1,540,000 | 5 | 3 | 1 | 3,400 | 156 |
4047806 | C | 20 | 22nd | Surf City | Surf City | $1,579,000 | 4 | 3 | 1 | 2,400 | 192 |
4013698 | C | 169 | Long Beach | Long Beach Twp | Loveladies | $1,700,000 | 5 | 6 | 1 | 3,409 | 938 |
4053359 | C | 87C | Long Beach | Long Beach Twp | Loveladies | $1,900,000 | 5 | 4 | 1 | 3,928 | 40 |
4048015 | C | 6 | Bergen | Harvey Cedars | Harvey Cedars | $2,025,000 | 4 | 3 | 1 | 2,500 | 176 |
4056564 | C | 116 | Dolphin | Beach Haven Borough | Beach Haven | $2,225,000 | 6 | 4 | 2 | 5,169 | 10 |
4050225 | C | 45C | Long Beach | Long Beach Twp | Loveladies | $2,297,500 | 5 | 5 | 0 | 3,600 | 122 |
4050104 | C | 120 | Texas (102nd St) | Long Beach Twp | Beach Haven Park | $2,650,000 | 6 | 5 | 1 | 5,300 | 75 |
Below is a breakdown of the specifics and averages of these home sales:
Status: Under Contract (3) | |||||||
Beds | Baths | Sq Ft Total | List Price | RATIO Current Price By SQFT | RATIO Close Price By List Price | DOM | |
Min | 4 | 2 | 2,088 | $968,000 | $463.60 | – | 28 |
Max | 6 | 4 | 2,364 | $1,439,000 | $635.91 | – | 117 |
Avg | 5 | 3 | 2,217 | $1,268,667 | $569.41 | – | 85 |
Median | 5 | 3 | 2,200 | $1,399,000 | $608.71 | 0 | 109 |
Sum | – | – | – | $3,806,000 | – | – | 0 |
Status: Closed (23) | |||||||
Beds | Baths | Sq Ft Total | List Price | RATIO Current Price By SQFT | RATIO Close Price By List Price | DOM | |
Min | 3 | 2 | 1,200 | $799,999 | $291.98 | 81.93% | 10 |
Max | 6 | 6 | 5,300 | $2,799,000 | $874.35 | 98.75% | 938 |
Avg | 5 | 3 | 2,775 | $1,556,730 | $540.18 | 92.95% | 148 |
Median | 4 | 3 | 2,580 | $1,475,000 | $502.11 | 0 | 122 |
Sum | – | – | – | $35,804,797 | – | – | 0 |
Status: All (26) | |||||||
Beds | Baths | Sq Ft Total | List Price | RATIO Current Price By SQFT | RATIO Close Price By List Price | DOM | |
Min | 3 | 2 | 1,200 | $799,999 | $291.98 | 81.93% | 10 |
Max | 6 | 6 | 5,300 | $2,799,000 | $874.35 | 98.75% | 938 |
Avg | 5 | 3 | 2,710 | $1,523,492 | $543.55 | 92.95% | 141 |
Median | 4 | 3 | 2,450 | $1,419,000 | $512.84 | 0 | 113 |
Sum | – | – | – | $39,610,797 | – | – | 0 |
Buying and Selling in the LBI Real Estate Market
There is strong evidence to suggest that the market is changing on LBI. In a shifting market it is more important than ever to understand what determines value in the LBI real estate market and what trends are developing. Reading and understanding Long Beach Island Real Estate Oceanblock Sales Updates and the other updates I regularly publish can help you to identify a good opportunity. For more information about buying, selling or investing on LBI please do not hesitate to contact me.
By : Nathan Colmer | The Van Dyk Group
Cell: 609-290-4293 | Office: 800-222-0131 | ncolmer@vandykgroup.com